HCP Consul Central network views
This topic describes the network views available through HCP Consul Central. These views provide information about both HashiCorp-managed clusters deployed in your organization and self-managed clusters linked to HCP Consul Central in your organization.
Consul overview
The unified overview provides an aggregated summary of both HashiCorp-managed and self-managed clusters, including their associated services. It displays overall cluster deployment information, service counts, and service instance health.
The Consul overview displays each cluster alongside the its status, cluster tier, peered HashiCorp Virtual Networks (HVNs), cloud platform and region where the cluster is deployed, and its license. For more details about trial access through the community license, refer to HCP Consul Central trial accoutns.
The Consul overview also displays version information for both HashiCorp-managed clusters and self-managed clusters that are linked to HCP Consul Central. When a cluster runs a version of Consul that is not the current release, a version badge appears to help you identify clusters to update. HCP Consul Central may display the following badges:
Version badges
HCP Consul displays version information for both HashiCorp-managed clusters deployed in your organization and self-managed clusters that are linked to HCP Consul Central. When a cluster runs a version of Consul that is not the current release, a version badge appears to help you identify clusters to update. HCP Consul may display the following version badges:
- Out of date: The Consul version is not the latest release, but it is still supported because it is within two major releases.
- Out of support: The Consul version is no longer supported because two or more major releases occured since the last update.
To learn more about cluster versions and upgrading, refer to Upgrade clusters on HCP Consul.
Access badges
HCP Consul can also provide specific information for self-managed clusters linked to HCP Consul with read-only access permissions. HCP Consul may display the following badges:
- Read-only: The link to this self-managed cluster was established using a read-only token. As a result, some HCP Consul Central operations are not available.
- Invalid token: The read-only token provided during the linking process did not allow HCP Consul to establish an authorized connection. Either an incorrect
SecretIDwas provided to HCP Consul, or the token does not have thebuiltin/global-read-onlyattached to it.
To learn more about the differences between read/write and read-only clusters, refer to Cluster access permissions.
Cluster details
You can get detailed information about your HashiCorp-managed and self-managed clusters in HCP Consul and directly access the Consul UI for each cluster from their cluster details.
The cluster details page provides the following information about your self-managed cluster:
- Number of registered services
- Number of service instances
- Number of sidecar proxies
- Number of clients
- Cluster status
- TLS status and expiration date
- Number of active and healthy servers
- Failure tolerance
The service and service instance counts reported on this page include the consul service that is automatically deployed with every Consul server.
You can also find detailed information about individual servers in each cluster. This information includes:
- Server name
- Consul version
- Raft state
- Server ID
- LAN address
- Gossip port
- RPC port
- Time elapsed since last contact with server
This page also provides the URLs and admin tokens used to access your cluster. Refer to Access HashiCorp-managed clusters for more information.
Access privileges to the Consul UI are determined by a user's access role in the HCP platform. For an explanation of how HCP roles map to access privileges, refer to link self-managed clusters. For more information on what access roles are and how to manage them, refer to user permissions.
Services
The unified services overview contains information about services and the associated service instances deployed on your network. You can use it to search for a service name and get a list of clusters where the service has instances deployed. In addition to listing services and grouping services that share a name, this view displays the following global network information about services instances:
- Health status badge. When all instances pass health checks by returning a successful 200-299 code, the badge displays
Healthy. A warning appears when one or more instances returns a 429 code. All other codes produce critical warnings. When instances return different codes, a count appears with multiple badges. - Number of service instances registered under a service name.
- The service's mTLS status. A
strict mTLSstatus indicates that the service's proxies are enforcing mTLS connections through Consul's certificate authority. Apermissive mTLSstatus indicates that the service is using Consul's transparent proxy features. - The service's participation in the service mesh. The
consulservice is never part of the service mesh because it functions in the control plane, not the data plane. - Sameness group. The name of the sameness group the service belongs to.
- Method of service registration. Registration options include: Consul, Consul API Gateway, Terraform, Vault, AWS, AWS-IAM, AWS Lambda, Kubernetes, and Nomad.
- Tags. User-defined custom tags associated with the service.
Filter and sort services
You can limit the services that appear in the unified services overview and sort the results. The following options are available for filtering services:
Cluster ID. Filters services according to the name of the cluster that the service is registered to.Search. The search bar enables filtering services by service name.Status. Filters services according to the status of their mostly recently performed health check.Type. Filters services according to service mesh functions, including gateways, whether the service is in the service mesh, and whether the service runs in strict mTLS or permissive mTLS mode.Source. Filters services according to their registration method. Registration options include: Consul, Consul API Gateway, Terraform, Vault, AWS, AWS-IAM, AWS Lambda, Kubernetes, and Nomad.
You can sort results alphabetically or according to status of their most recent health check.
Service overview
Click on a service's card in the unified overview to view details about the service and its registered instances, including charts that visualize the following aspects of the service's performance.
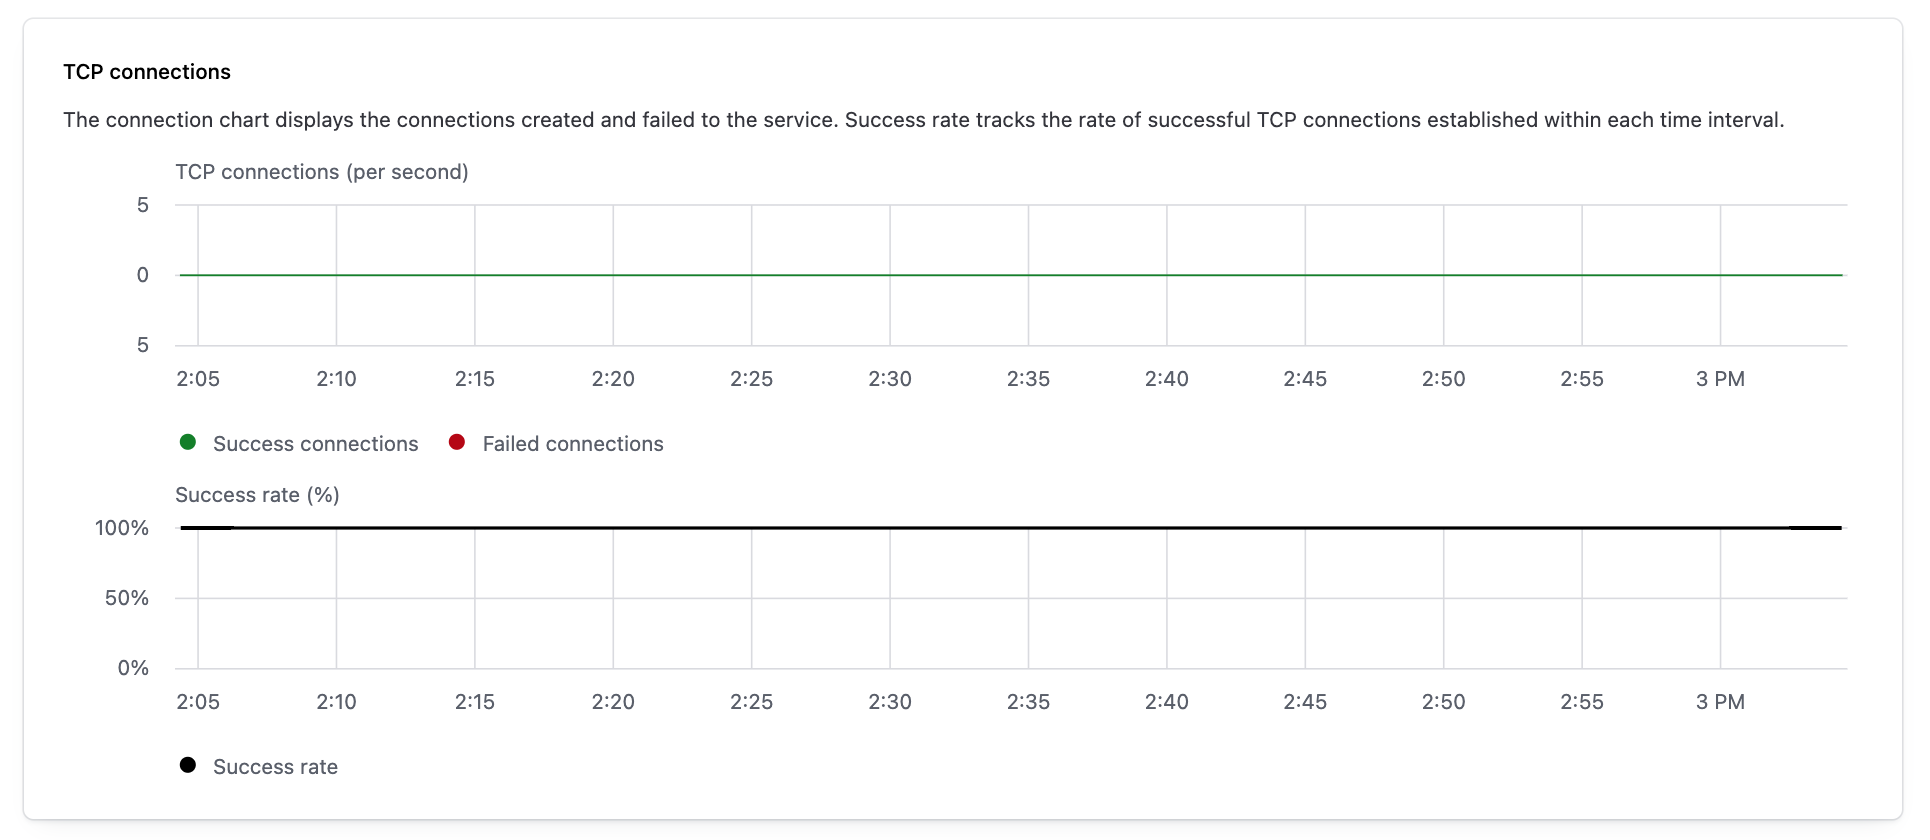
TCP connections
The connections chart displays the successful and failed connection attempts made to the service, as well as the overall success rate over time.

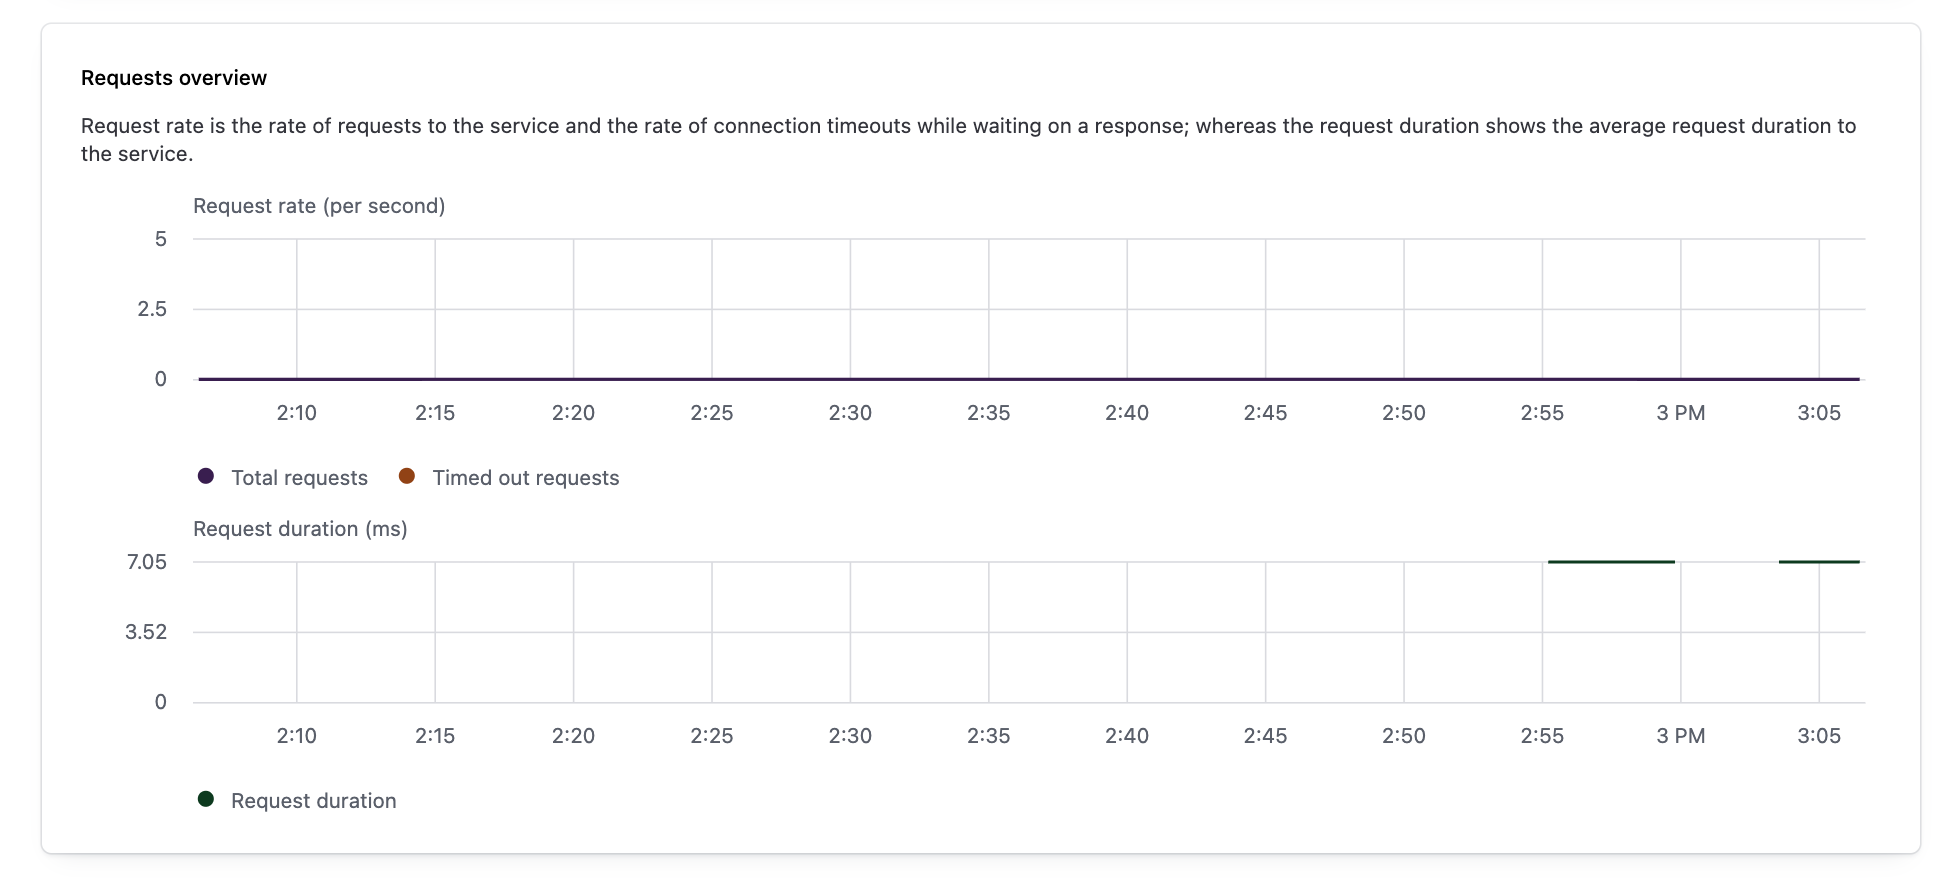
Requests overview
The request rate per second chart visualizes the rate of requests to the service and the rate of connection timeouts while waiting for a response. The request duration chart shows the average request duration to the service.

Response HTTP status codes
The response HTTP status codes chart displays the rate of HTTP response codes from the service by class.

Data transfer
The data transfer chart displays the rate of data sent to and received from other services in bytes per second.

Service instances
You can also review information about each individual service instance. Each service instance appears in a card that contains the following information:
- Service checks. The number of health checks registered with the service instance and the most recent results of those checks.
- Node checks. The number of health checks on the service instance's nodes and the most recent results of those checks.
- Network address. The network address for the service instance in its cluster.
- Sameness group. The name of the sameness group the service instance belongs to.
- Method of service registration. Registration options include: Consul, Consul API gateway, Terraform, Vault, AWS, AWS-IAM, AWS Lambda, Kubernetes, and Nomad.
- Tags. User-defined custom tags associated with the service instance.
You can search for service instances by name, as well as filter and sort service instances according to the the results of recent health checks.
Cluster peering
The cluster peering view lists active cluster peering connections between your clusters. It also provides a global workflow that you can use it create new cluster peering connections, check the status of individual connections between clusters, and confirm the number of services that are available to other clusters.
For each cluster with at least one existing cluster peering connection, the following information is available:
- Name of the cluster with cluster peering connections
- Name of the admin partition with the cluster peering connection
- Number of peers connected to that cluster and admin partition
When you click the name of a cluster, HCP Consul Central displays additional details about each cluster peering connection. The following information about individual connections is available:
- Name of each peer with an active connection
- Names of cluster and admin partition for each peer
- Status of each cluster peering connection
- Heartbeat, or the time elapsed since HCP Consul Central detected a connection and updated the status
- Number of services the cluster imported from the peer
- Number of services exported from the cluster to the peer
To appear in the list of cluster peering connections, you must create the cluster peering connection using HCP Consul Central. Externally created cluster peering connections can interact with clusters that have connections created through HCP Consul Central, but they do not appear in the cluster peering view.
For more information about using HCP Consul Central to create cluster peering connections, refer to create cluster peering connections in the HCP documentation. For more information about cluster peering in general, refer to cluster peering overview in the Consul documentation.
Peering connection status
HCP displays one of the following statuses to indicate the current state of the cluster peering connection:
Connecting
The Connecting status appears after you create a cluster peering connection. It indicates that HCP is attempting to exchange peering tokens to establish connectivity between the clusters.
If the status does not change automatically after 5 to 10 minutes, it indicates an issue in the setup process. Check each of the following:
- The cluster names and admin partitions you selected are the intended peers.
- The clusters each belong to a cluster tier that supports network connectivity with the other's region and cloud provider.
- The self-managed clusters were already linked to your HCP account.
After you determine the issue, delete the connection and attempt to establish a new one.
Active
The Active status indicates that the peering tokens were exchanged and the cluster peering connection passed a health check. When a connection's status is Active, you can export services to make them available to peers with active cluster peering connections.
Failing
The Failing status indicates that the cluster peering connection failed its most recent health check and services are not available to peers. This status can appear if you remove a cluster from your network without deleting its cluster peering connection.
Deleting
The Deleting status indicates that the cluster peering connection was deleted from the peer. When you delete a connection from one of the clusters, its peering tokens and imported services are also deleted.
If ending the cluster peering connection was intentional, click More (three dots) and then Delete connection to remove it from the list.
If ending the cluster peering connection was not intentional, delete the connection to remove it from the list. Then, click Create cluster peering connection to restart the process for establishing a cluster peering connection.